Printable Star Chart for Tonight
A printable star chart for tonight usually means a monthly sheet drawn for one latitude, 40° north as a rule. This one is drawn for your own town and tonight’s date: pages in black ink with the sky to hold overhead and its keys, a list of the Moon, the planets and the binocular targets that are actually up tonight, with their rise and set times, and the month’s Moon phases, meteor-shower peaks and eclipses on your town’s own clock.
Make tonight's chart for your town
Free, in your browser — no account, nothing uploaded. The button opens the generator on today's date at 21:00 over the town your device's time zone points to; change the town or the time there. Download PDF writes all three pages, A4 or US Letter; PNG and SVG are page 1.
What you print
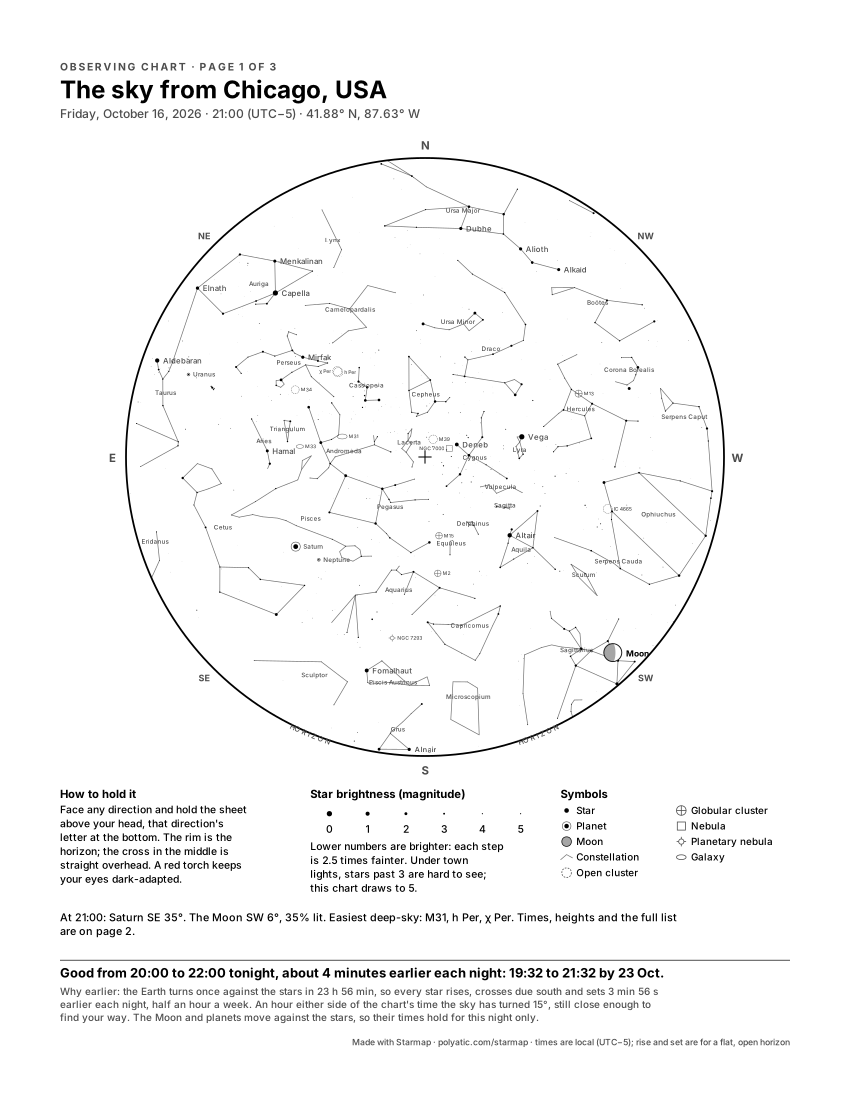
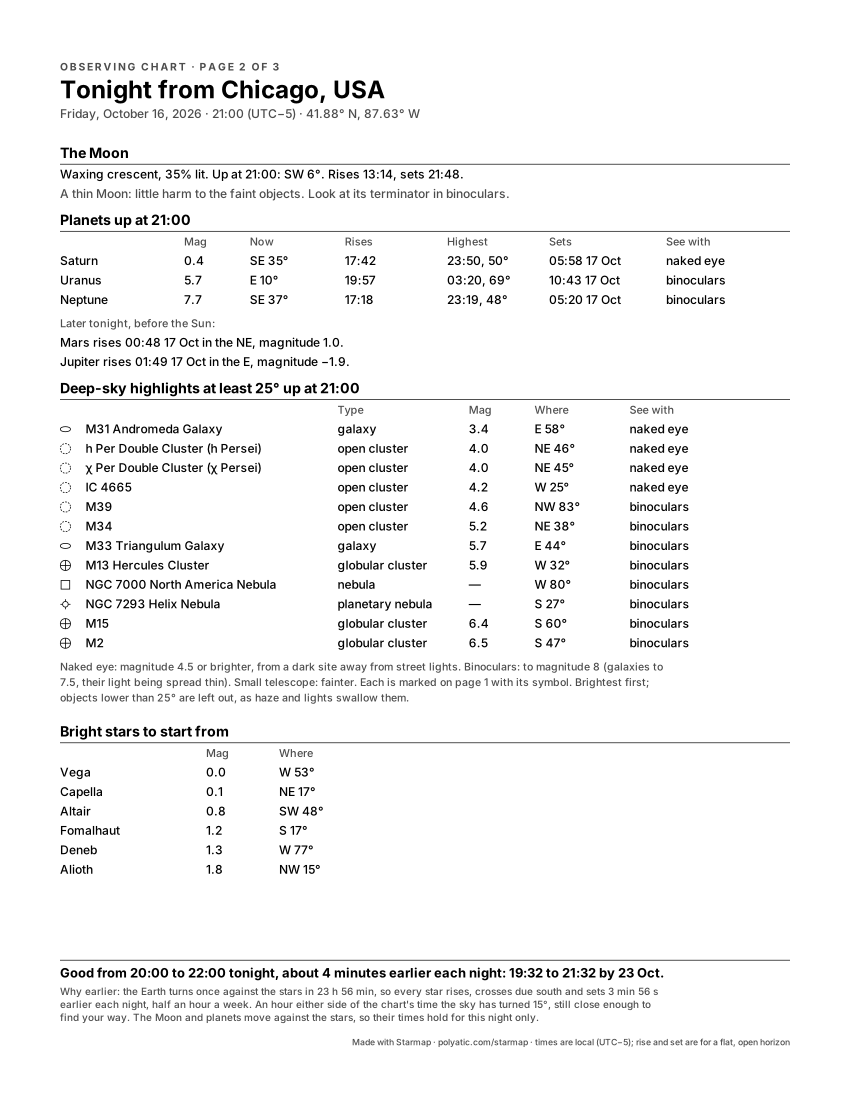
Pick Layout → Observing chart (the button above does it for you) and the generator draws three pages, A4 (21 × 29.7 cm) or US Letter (8.5 × 11 in); Download PDF writes them at that real size. Page 1 is the whole sky above your horizon at the time you set, with a key underneath. Page 2, “Tonight from …”, is a table: the Moon’s phase, rise and set; every planet that is up, with its brightness, where it is now and when it rises, stands highest and sets; 8 to 12 deep-sky objects at least 25° up; and the brightest stars to find your way from. Page 3, “This month from …”, covers the calendar month of your date (untick This month from your town for the two-page sheet). All three are black on white, so a cheap mono laser prints them cleanly.
In the Chicago example, 21:00 on Friday 16 October 2026, page 2 says the 35%-lit crescent Moon is only 6° up in the south-west and sets at 21:48, so look at it first; Saturn is 34° up in the south-east and highest at 23:50; Mars rises at 00:48 and Jupiter at 01:49; and the Andromeda Galaxy (58° up in the east) and the Double Cluster in Perseus lead the deep-sky list as naked-eye targets from a dark site.
Page 3: the month from your town
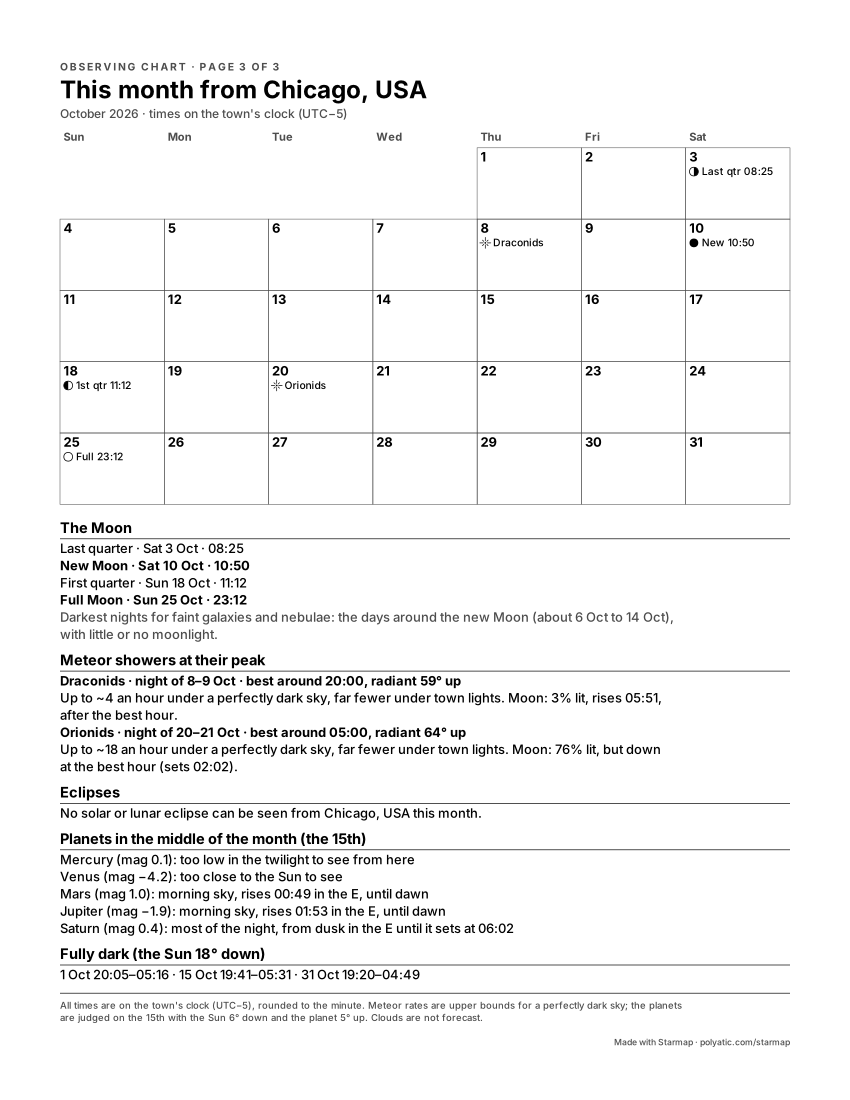
A monthly sky sheet usually prints its calendar of events once, for everybody, so you convert the times yourself and a shower’s best hour or an eclipse’s visibility is left to you. Page 3 works them out for the town on the chart:
- The Moon’s phases, new, first quarter, full and last quarter, dated and timed to the minute on the town’s clock, summer time included. A full Moon at 23:23 UTC on 20 February 2027 is printed for Copenhagen as 21 February, 00:24, the date a Dane would put on it. The days around the new Moon are named as the darkest for galaxies and nebulae.
- Every major meteor shower peaking that month (the International Meteor Organization’s ten), with its peak night, the hour its radiant stands highest in a dark sky from your town, the most it can show under a perfectly dark sky, and what the Moon does at that hour. For Copenhagen in December 2026 the Geminids’ night is 13–14 December, best around 02:00 with the radiant 67° up and a 21%-lit Moon setting at 19:52; that is up to about 140 an hour under a truly dark sky, far fewer under town lights.
- Any solar or lunar eclipse seen from the town, with its start, greatest moment and end on the local clock, and for a solar eclipse the rule that you never look at the Sun without certified eclipse glasses. From Seville on 2 August 2027 that is a partial eclipse from 09:42 to 12:00, greatest at 10:48 with 98% of the Sun covered (Seville lies just outside the path of totality).
- One line for each bright planet, Mercury to Saturn: evening sky, morning sky, most of the night, or too close to the Sun, judged on the 15th with the Sun 6° down. Planets near a change, Mercury above all, can have moved on by the month’s end.
- When it is fully dark (the Sun 18° down) on the 1st, the 15th and the last day, or how close it gets in a summer month that never goes fully dark.
It prints in German or Danish when the poster language is German or Danish. Clouds are not forecast.
How to use it outside
- Hold it overhead, turned to match the ground. Face the part of the sky you want, say south, and hold the sheet up with the S at the bottom edge. Its N now points north and its E and W point east and west. That is why east is printed on the left: a ground map has it on the right because you look down at it, a sky chart is read looking up. The rim is the horizon and the small cross in the middle is the point straight overhead, so a star halfway between rim and cross is about 45° up.
- Use a red light. The eye’s night vision comes from the rods, which barely respond to deep red. A torch with a red filter (or red cellophane over a white one, a few layers thick) lets you read the sheet without undoing your night vision; one look at a white phone screen does.
- Give your eyes about 20 minutes. Most of the eye’s dark adaptation happens in the first 20 to 30 minutes away from bright light. The faint stars on the chart, magnitude 4 and 5, mostly appear only after that.
- Start from what is bright. Find the brightest star or planet on page 2 (Vega, 53° up in the west, in the Chicago example), match it to its dot, then hop along the constellation lines to fainter things.
What the symbols and the key mean
- Dot size is brightness, in magnitudes. The key runs from 0 to 5. Lower numbers are brighter, and each step is 2.5 times fainter, so a magnitude-0 star such as Vega is 100 times brighter than a magnitude-5 one. The chart draws all 1,630 stars of the Yale Bright Star Catalogue to magnitude 5.0 that are above your horizon. Under town lights you will see stars to about magnitude 3, which is only 174 of the 1,630 across the whole sky, so expect to see far fewer dots than are printed.
- Planets are a dot inside a ring, labelled. Mercury to Saturn are drawn when they are up. Uranus (about magnitude 5.7) and Neptune (about 7.7) are marked too, with the same symbol drawn small and a grey label: Uranus is just within reach of a sharp eye at a dark site and easy in binoculars, Neptune needs binoculars and a steady hand. The Moon is drawn at its phase.
- Deep-sky objects get five shapes: open cluster, globular cluster, nebula, planetary nebula and galaxy. Page 2 marks each one “naked eye” (magnitude 4.5 or brighter, from a dark site), “binoculars” (to magnitude 8, galaxies to 7.5, as their light is spread thin) or “small telescope”. They are picked from 133 objects, the 110 in the Messier catalogue plus 23 showpieces, brightest first, and only those at least 25° up, since haze and lights swallow anything lower.
Why a chart is good for one evening
The Earth turns once against the stars in 23 h 56 min, not 24 h, so every star rises 3 min 56 s earlier each night. Over a month that adds up to about 2 hours, which is 2 hours of right ascension or 30° of sky. The stars on a chart for 16 October at 21:00 are the stars of 16 November at about 19:00, and of 16 September at about 23:00. That is why the sheet prints its own window, “Good from 20:00 to 22:00 tonight, about 4 minutes earlier each night: 19:32 to 21:32 by 23 Oct” in the Chicago example: an hour either side of the chart’s time the sky has turned 15°, still close enough to find your way. The Moon and the planets move against the stars, so their positions and times on page 2 hold for that one night only. A monthly chart drawn for 40° north has the same drift and a second problem: from 52° north or 34° south its horizon is in the wrong place, and a whole band of sky is missing or extra.
What the chart draws
The chart holds the 1,630 stars brighter than magnitude 5.0 and the 89 constellation figures, and the Milky Way is drawn as a soft band. The Moon is drawn in its real phase, and left off when it was below your horizon. The five naked-eye planets, Mercury, Venus, Mars, Jupiter and Saturn, are drawn where they stood. The Sun is drawn too whenever it was up, and the caption says whether your moment was daylight, twilight or full dark: the stars are always drawn where they stood, even when daylight or twilight hid them. So is an eclipse, if your moment falls inside one. Uranus, Neptune and 133 deep-sky objects are one switch away: tick Deep-sky objects and the chart marks the Messier objects and southern showpieces and adds Uranus and Neptune (see this page’s example with them). Great comets since 1900 can be added (Hale-Bopp over London, 1997). Not drawn: faint comets and satellites, whose orbits this tool does not compute. Every position is carried to your date by precession. Not modelled: the stars’ own proper motion. A date before 15 October 1582 is read in the Julian calendar. It all runs in your browser, nothing is uploaded, and the downloads are complete and free. Accuracy, print sizes and privacy, answered in full.
Common questions
Does the chart know about clouds, light pollution or the buildings around me?
No. Cloud, light pollution and your local horizon (trees, hills, houses) are not modelled. The chart shows what is above a flat, open horizon on a clear night, and every rise and set time assumes that horizon, so a hill to the east delays a rising by minutes. Whether tonight is dark enough is a separate question: the stargazing night planner scores how dark tonight is from the Moon and the Sun and gives the dark window, though it does not forecast cloud either.
Can I print a chart for another night, or a past date?
Yes. Change the date in the form at the top, or use the star chart for any date and location, which draws the sky for any date from the year 1 to 3000 and explains the astronomy behind it.
How long is the chart good for?
For the stars, about an hour either side of the time printed on it tonight, and about the same sky 4 minutes earlier each following night. For the Moon and the planets, tonight only. Print a fresh one each session; it takes a few seconds.
Does it work in the southern hemisphere?
Yes. The chart is computed for the latitude and longitude of the town you pick, so from Sydney it shows the sky around the south celestial pole, the Southern Cross included, with Sydney’s own horizon at the rim. A monthly sheet drawn for 40° north cannot do that.
Which paper and which download should I use?
Download PDF gives all the pages at the real A4 or US Letter size, so print it at 100% (not “fit to page”). PNG and SVG hold page 1 only. Black ink on white is deliberate: it reads under a red light and costs no colour toner.
Why are there more stars on the paper than in my sky?
The chart draws every star to magnitude 5.0, which is what a good eye sees at a dark site. From a town you will see stars to about magnitude 3, roughly one printed star in nine. Use the bright ones as signposts and the faint dots as a guide to what binoculars will show.